
 Software
Share This Article
Creating visually compelling infographics and data visualizations is no longer a luxury reserved for seasoned graphic designers with access to complex software. In today’s fast-paced digital world, educators, marketers, and even designers themselves need efficient ways to communicate information effectively through visuals. The challenge often lies in bridging the gap between data and design, especially when time, budget, or specific design skills are limited. Many struggle to produce professional-looking graphics quickly, resorting to generic templates or spending hours wrestling with tools not built for intuitive infographic creation. This is where tools like Graficto step in, offering a streamlined solution specifically designed to empower anyone to create powerful smart infographics without needing a design background. If you’re looking for a user-friendly way to transform your data and ideas into engaging visuals, Graficto might be the answer.
The Challenge: Visual Communication Without Design Skills
In nearly every professional field, the ability to present information clearly and engagingly is crucial. Educators need to capture student attention and simplify complex topics. Marketers must create eye-catching content for social media, reports, and presentations to drive engagement and conversions. Graphic designers, while skilled, often face tight deadlines and need tools for rapid prototyping or specific data visualization tasks that traditional design software might make cumbersome.
The core problem arises when individuals or teams lack dedicated design resources or the specialized skills required for creating high-quality infographics. Common hurdles include:
- Steep Learning Curves: Professional design software like Adobe Illustrator is powerful but requires significant time investment to master.
- Time Constraints: Manually arranging elements, choosing color palettes, and ensuring design consistency takes considerable time, even with simpler tools like Canva (which Graficto serves as a strong alternative to).
- Data Visualization Complexity: Transforming raw data into clear, accurate, and aesthetically pleasing charts and graphs can be particularly challenging without the right tools or expertise.
- Maintaining Brand Consistency: Ensuring all visuals adhere to specific brand guidelines (colors, fonts) can be difficult across different projects and creators.
- Cost of Software and Talent: Hiring designers or subscribing to high-end software suites can be expensive, especially for smaller organizations, educators, or freelancers.
The result? Often, potentially impactful information gets lost in text-heavy documents, uninspired presentations, or poorly designed visuals that fail to resonate with the intended audience. This leads to missed opportunities for engagement, understanding, and achieving communication goals.
Graficto: The Smart Solution for Effortless Infographics
Graficto directly addresses these challenges by providing a “smart” platform focused specifically on infographic and visual creation. It’s built on the premise that creating professional visuals shouldn’t require extensive design knowledge. Instead of giving you a blank canvas and complex tools, Graficto offers intelligent templates and a streamlined workflow.
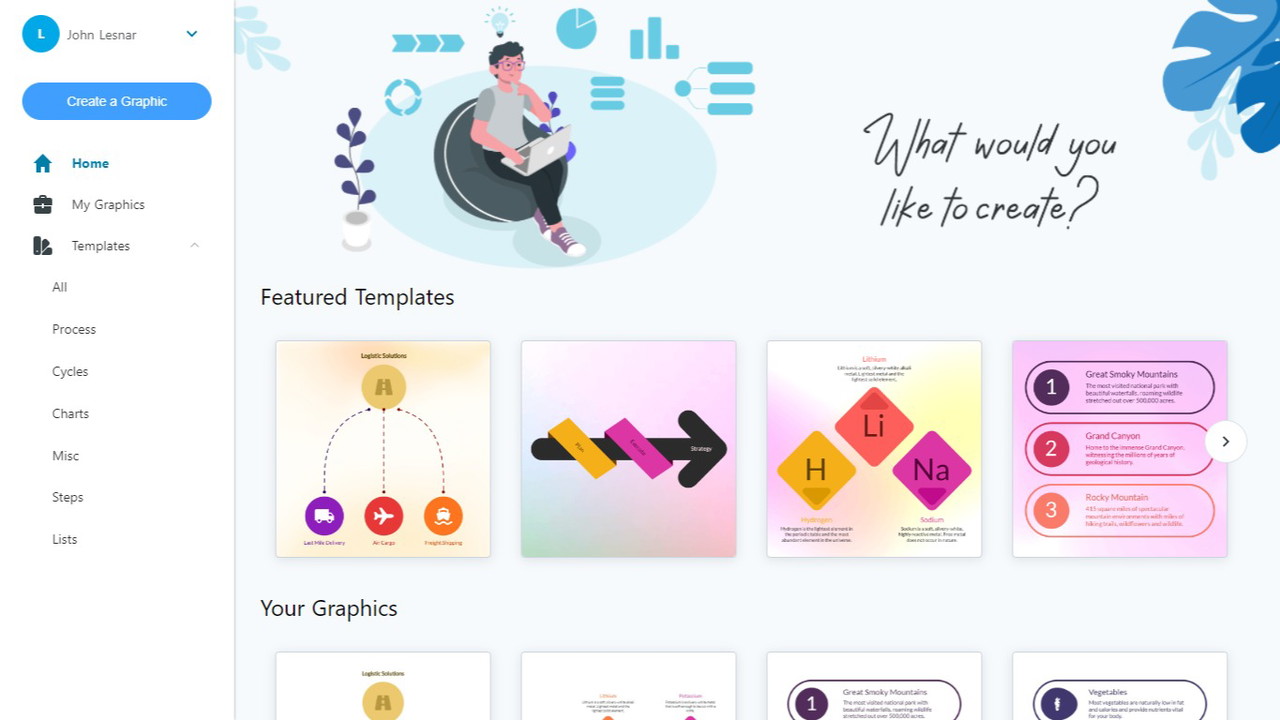
How does it work? You simply:
- Choose a Design Template: Select from a wide variety of professionally designed infographic templates categorized by type (lists, timelines, comparisons, processes, cycles, etc.).
- Enter Your Data/Text: Input your information directly into structured fields. Graficto handles the layout and arrangement automatically.
- Customize the Look: Easily change colors, fonts, icons, and add your own images or logos to match your brand or style. Graficto’s smart features ensure design consistency is maintained even as you customize.
- Export Your Visual: Download your finished infographic in various formats (like PNG, JPG, PDF, or even SVG for high-resolution needs).
This approach fundamentally changes the creation process. Instead of focusing on *how* to design, users can focus on *what* they want to communicate, letting Graficto manage the design heavy lifting. It’s particularly effective for turning lists, processes, comparisons, and data points into easily digestible and visually appealing formats.
Key Features and Benefits of Graficto
Graficto isn’t just another general design tool; its strength lies in its specialized focus on infographics and smart features tailored for ease of use and professional output. Here’s a breakdown of what makes it stand out:
- Smart Templates & Structures: Graficto offers a rich library of templates designed for specific infographic types (timelines, comparisons, processes, etc.). These aren’t just static backgrounds; they are intelligent structures that adapt as you input your data, ensuring optimal layout and readability automatically. This saves immense time compared to manual arrangement.
- Effortless Data Entry: Forget painstakingly placing text boxes and icons. You simply type your information into predefined fields, and Graficto populates the template correctly. This is ideal for quickly visualizing lists, steps, or comparative data.
- One-Click Design Variations: Want to see how your infographic looks with a different layout or style? Graficto often allows you to switch between design variations for the same data with a single click, maintaining consistency while offering creative options.
- Extensive Icon & Image Library: Access a built-in library of icons and images to enhance your visuals, or easily upload your own logos and graphics for complete branding control.
- Easy Customization: While templates are smart, you still have control. Adjust colors (using predefined palettes or your own hex codes), change fonts, modify icon choices, and tweak elements to perfectly match your needs or brand identity.
- Multiple Export Options: Download your creations in high-resolution formats suitable for web (PNG, JPG) and print (PDF), as well as vector format (SVG) for scalability without loss of quality.
- No Design Skills Required: This is the core benefit. Graficto is designed from the ground up for non-designers, enabling educators, marketers, and business professionals to produce visuals that look like they were made by a pro.
- Efficiency for Designers: Even professional graphic designers can benefit from Graficto’s speed for creating quick data visualizations, mockups, or handling repetitive infographic tasks more efficiently than starting from scratch in complex software.
Who is Graficto Best For?
Graficto’s ease of use and focus on structured visuals make it ideal for specific user groups:
- Educators: Teachers, trainers, and course creators can quickly design engaging learning materials, explain complex processes, create timelines for historical events, or visualize survey results for class projects. The ability to produce professional visuals without needing design training is invaluable.
- Marketers: Content marketers, social media managers, and digital strategists can rapidly generate eye-catching infographics for blog posts, social media campaigns, email newsletters, and client reports. It helps communicate statistics, features, benefits, and processes in a more shareable and digestible format than plain text. Consider pairing visuals from Graficto with a robust social media management tool like Sociamonials to streamline distribution and boost ROI.
- Graphic Designers: While designers have advanced tools, Graficto can be a valuable addition for specific tasks. It excels at quickly generating data-driven charts and structured infographics (like process flows or comparisons) that might be time-consuming to build manually, freeing them up for more complex creative work. It’s a great tool for rapid prototyping.
- Small Business Owners & Entrepreneurs: Individuals managing multiple roles can use Graficto to create professional marketing materials, internal process documents, and presentations without hiring a designer or investing heavily in complex software.
- Bloggers & Content Creators: Enhance blog posts and articles with custom infographics that summarize key points, present data, or illustrate concepts, making content more engaging and shareable.
Graficto empowers users to transform data and ideas into stunning visuals effortlessly, democratizing the creation of professional-quality infographics.
LifetimeSoftwareHub Team
Graficto vs. Alternatives like Canva
While tools like Canva are excellent general-purpose design platforms, Graficto offers distinct advantages specifically for infographic creation:
- Focus on Structure: Graficto excels with structured data (lists, timelines, processes). Its smart templates automatically handle layout based on your input, which can be much faster than manually arranging elements in Canva.
- Simplicity & Speed: For users specifically needing infographics without the bells and whistles of a full design suite, Graficto’s focused interface can be quicker and less overwhelming to learn and use.
- Intelligent Design Assistance: Graficto’s “smart” features automate aspects of design consistency and layout, reducing the need for manual adjustments.
Canva, on the other hand, offers a broader range of design types (social media posts, presentations, videos, documents) and more freeform creative control. The best choice depends on your primary needs. If your main goal is creating structured infographics quickly and easily without prior design experience, Graficto is a purpose-built solution worth exploring.

Visuals and Beyond: Considering Your Full Toolkit
Creating compelling visuals with Graficto is a fantastic step towards better communication. However, effective marketing and online presence often require a combination of tools. While Graficto handles your infographics, you might need other specialized software for different tasks. For instance, if you need animated visuals or explainer videos, a tool like Animazer could be a great complement, particularly for content creators and small businesses looking to add motion to their marketing. Similarly, while stunning visuals attract attention, ensuring your website itself is technically sound and optimized for search engines is crucial for visibility. This involves a different kind of analysis, often raising questions like What is SiteGuru and how can SEO audit tools help improve website health? Understanding the distinct roles of different tools – from visual creation with Graficto to SEO analysis or even video creation with tools like ScreenToVideo for easy video tutorials – helps build a comprehensive strategy.
Exploring options like Lifetime SaaS Deals can also be a cost-effective way to build your software stack without recurring monthly fees. Finding the right combination of tools allows you to cover all bases, from content creation to distribution and technical optimization.
How to Get Started with Graficto
Getting started with Graficto is designed to be straightforward:
- Visit the Website: Head over to the Graficto website.
- Explore Templates: Browse the available infographic templates to get a feel for the styles and structures offered.
- Sign Up: Create an account (often there’s a free trial or plan to test the waters).
- Choose a Template & Input Data: Select a template that fits your content and start entering your text or data into the guided fields.
- Customize: Adjust colors, fonts, and icons to match your brand or preference. Upload your logo if needed.
- Download: Export your finished infographic in your desired format.
The intuitive interface means most users can start creating effective visuals within minutes, without needing tutorials or extensive training.
Conclusion: Elevate Your Visuals Effortlessly
In a world saturated with information, cutting through the noise requires clear, engaging, and professional communication. Infographics are a powerful tool for achieving this, but their creation has often been a barrier for those without design skills or resources. Graficto effectively removes this barrier, offering a smart, intuitive platform specifically designed for creating stunning infographics and visuals quickly and easily.
For educators needing engaging lesson materials, marketers seeking compelling content, and even designers looking for efficiency in data visualization, Graficto provides a focused, user-friendly solution. Its smart templates, effortless data input, and easy customization empower anyone to turn ideas and data into professional-quality visuals.
If you’re ready to stop struggling with complex design software or settling for mediocre visuals, it’s time to explore what Graficto can do for you.
Related Reading
Frequently Asked Questions (FAQ) about Graficto
1. Do I need any design experience to use Graficto?
No, absolutely not. Graficto is specifically designed for users without any prior design skills or experience. Its smart templates and intuitive interface handle the design aspects for you.
2. What types of infographics can I create with Graficto?
Graficto offers templates for various structured infographics, including lists, timelines, processes, cycles, comparisons, data charts (like bar graphs, pie charts), pyramids, and more.
3. Can I use my own brand colors and logo?
Yes. Graficto allows you to customize color palettes (including using specific hex codes) and upload your own logo and images to ensure brand consistency.
4. What formats can I export my infographics in?
You can typically export your creations in web-friendly formats like PNG and JPG, print-ready PDF, and scalable vector format (SVG).
5. How is Graficto different from Canva?
While Canva is a versatile general design tool, Graficto specializes in structured infographics. Its key difference lies in the “smart” templates that automatically adjust layout based on your data input, making the creation of certain infographic types faster and more automated than manual arrangement in Canva. Graficto is less about freeform design and more about efficient, structured visual communication.
6. Is Graficto suitable for complex data visualization?
Graficto is excellent for creating clear, common chart types (bar, line, pie) and structured diagrams quickly. For highly complex, multi-layered scientific or statistical visualizations, specialized data viz software might still be necessary. However, for most business, marketing, and educational purposes, Graficto is highly capable.

